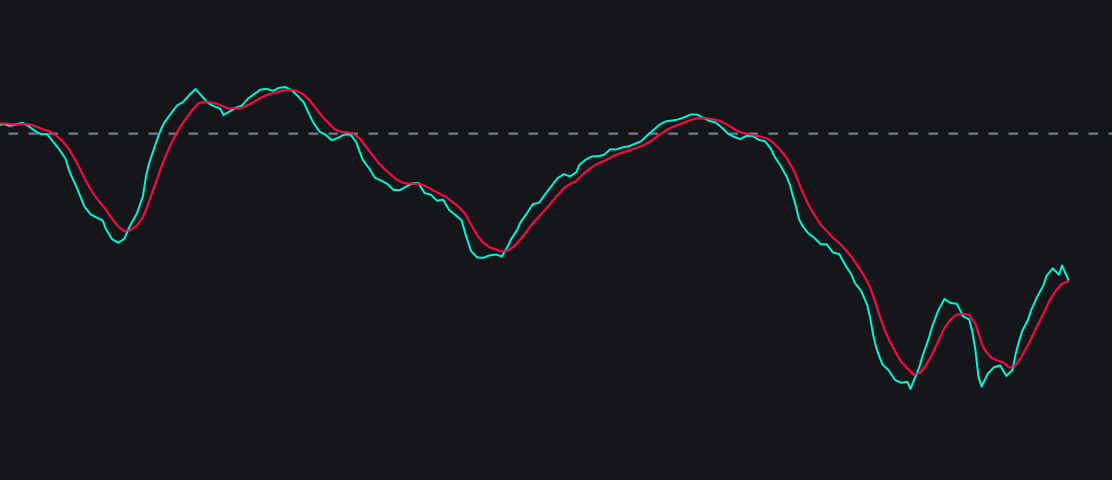

Klinger Volume Oscillator
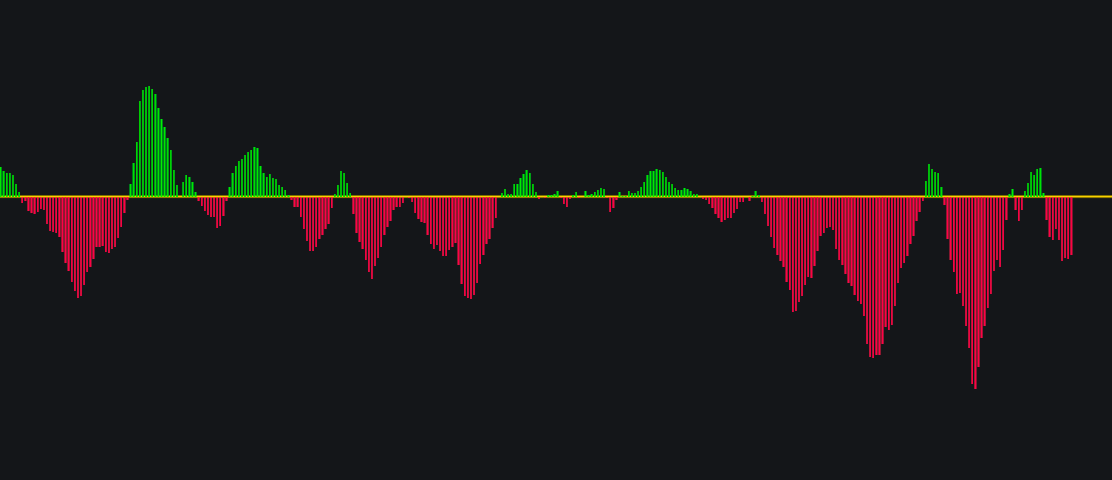
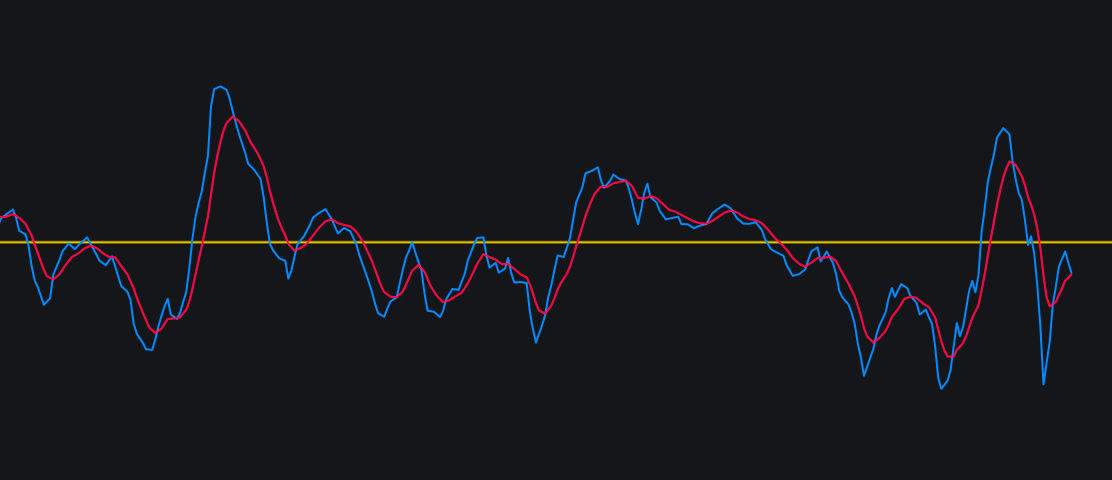
The Klinger Volume Oscillator (KVO) is a technical analysis indicator that predicts price reversals by comparing the relationship between price movement and trading volume. It bridges short-term fluctuations with long-term money flow to identify buying…
The Klinger Volume Oscillator (KVO) is a technical analysis indicator that predicts price reversals by comparing the relationship between price movement and trading volume. It bridges short-term fluctuations with long-term money flow to identify buying…