reinner's Cover image
MFI - Money Flow Indeximage
MFI - Money Flow Index
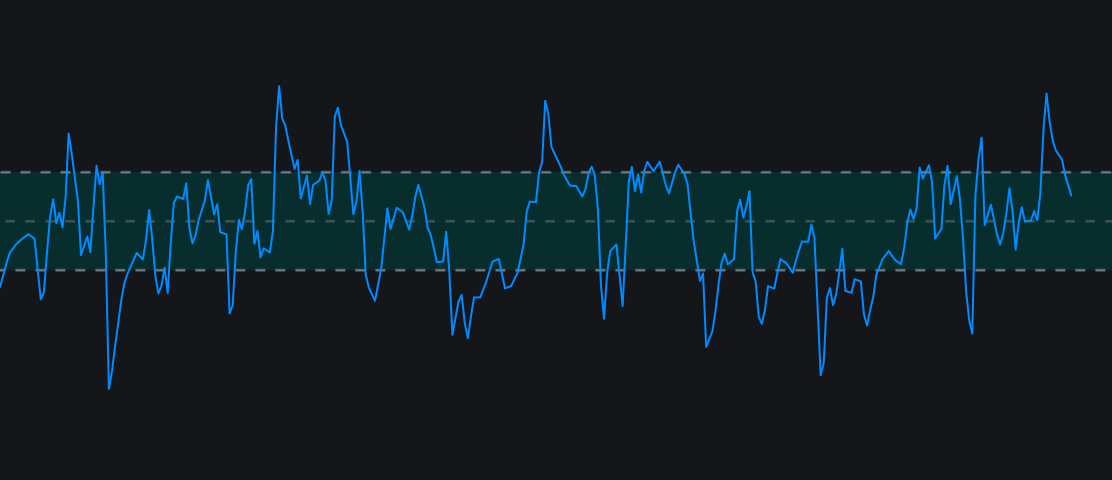
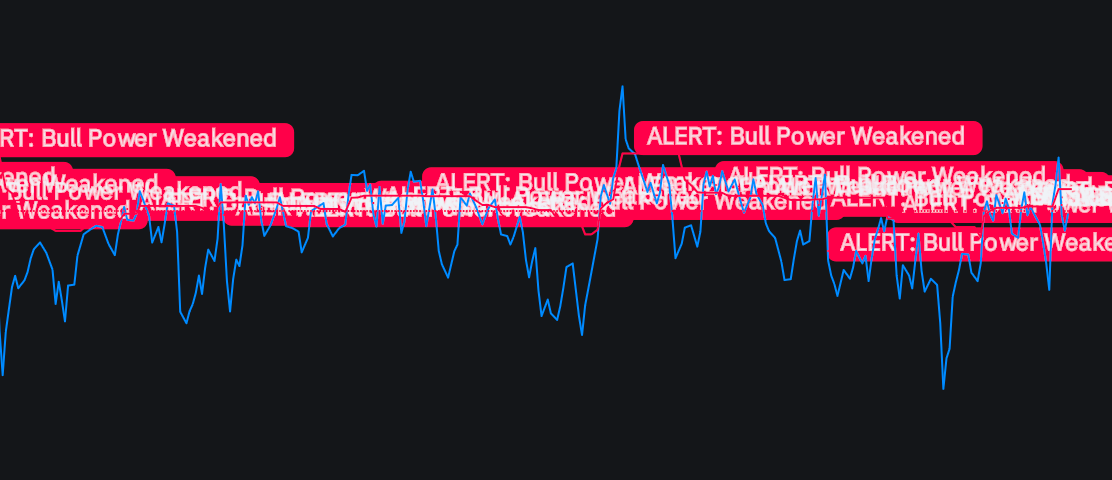
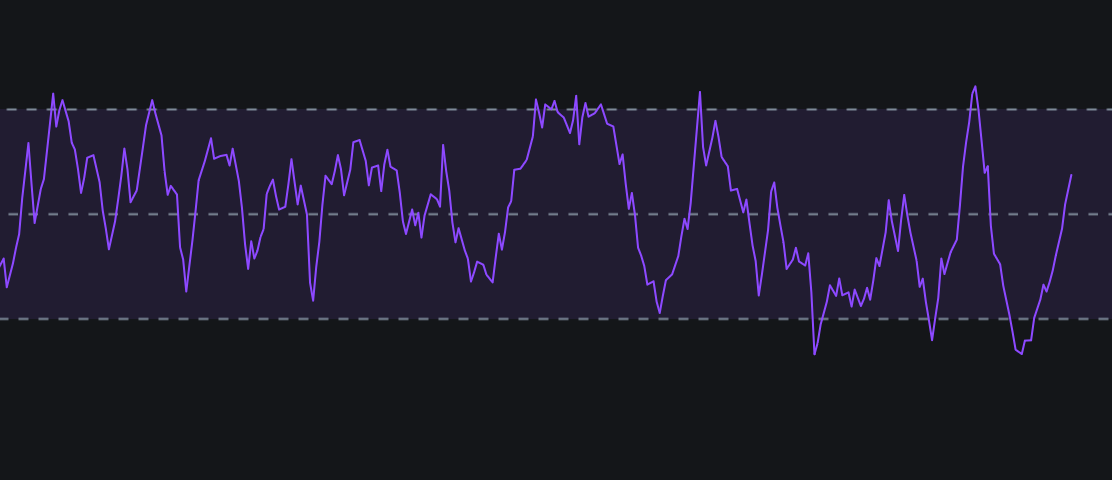
MFI with Alerts: Indicator Overview The MFI (Money Flow Index) with Alerts is a volume-weighted momentum oscillator used to measure the inflow and outflow of money into a financial asset over a specific period. Often referred to as the "Volume-Weighted…
/indicator/mfi-money-flow-index-20
CCI - commodity channel index + Alertsimage
CCI - commodity channel index + Alerts
CCI with Alerts: Indicator Overview The CCI (Commodity Channel Index) with Alerts is a versatile, momentum-based technical indicator designed to identify cyclical trends, determine overbought or oversold market conditions, and spot potential trend reve…
/indicator/cci-commodity-channel-index-alerts-63
relative strength index + Over Alertimage
relative strength index + Over Alert
The RSI (Relative Strength Index) is a popular momentum oscillator used in technical analysis. It measures the speed and change of price movements on a scale from 0 to 100 to help traders identify whether an asset is overvalued or undervalued. Unde…
/indicator/relative-strength-index-over-alert-75
CVD + Volume Deltaimage
CVD + Volume Delta
Delta Volume + CVD Heatmap This indicator combines Volume Delta , Cumulative Volume Delta (CVD) , and relative intensity analysis to identify buying or selling dominance in the market. The Delta is calculated as the estimated difference between buying …
/indicator/cvd-volume-delta-47
Candle patternsimage
Candle patterns
A customizable Candle Pattern  Indicator that detects key bullish and bearish candlestick formations in real time and sends instant  alerts  when patterns appear. Traders can individually enable or disable each pattern to match their strategy and reduc…
/indicator/candle-patterns-97
Bull Bear Power 50% alertimage
Bull Bear Power 50% alert
Bull Bear Power indicator using EMA to detect trend strength and generate alerts when price reaches 50% of the projected movement, helping traders identify potential entry and reversal zones with improved timing and market momentum analysis.
/indicator/bull-bear-power-50-alert-13
Moon Phase Signalimage
Moon Phase Signal
To receive an alert at the moment the moon phase changes from Full Moon to New Moon : Set: Source: "Combined Alert Signal" Criteria: "Outside Channel" Upper Bound: 0.5 Lower Bound: -0.5 The Moon Phases indicator displays the lunar cycle directly o…
/indicator/moon-phase-signal-66
Double - Supertrendimage
Double - Supertrend
The Double Supertrend Indicator The Double Supertrend is an advanced, trend-following technical analysis indicator that combines two distinct Supertrend calculations—typically one faster (short-term) and one slower (long-term)—onto a single price chart…
/indicator/double-supertrend-45